
PercentEdge Press · Level 1
Reading Charts
A practitioner’s course in technical analysis, built entirely on real Indian-market charts. From candlesticks to the option chain and the Greeks.
- 71 pages · 41 real Indian-market charts
- Nifty, Bank Nifty and real stock examples, not textbook diagrams
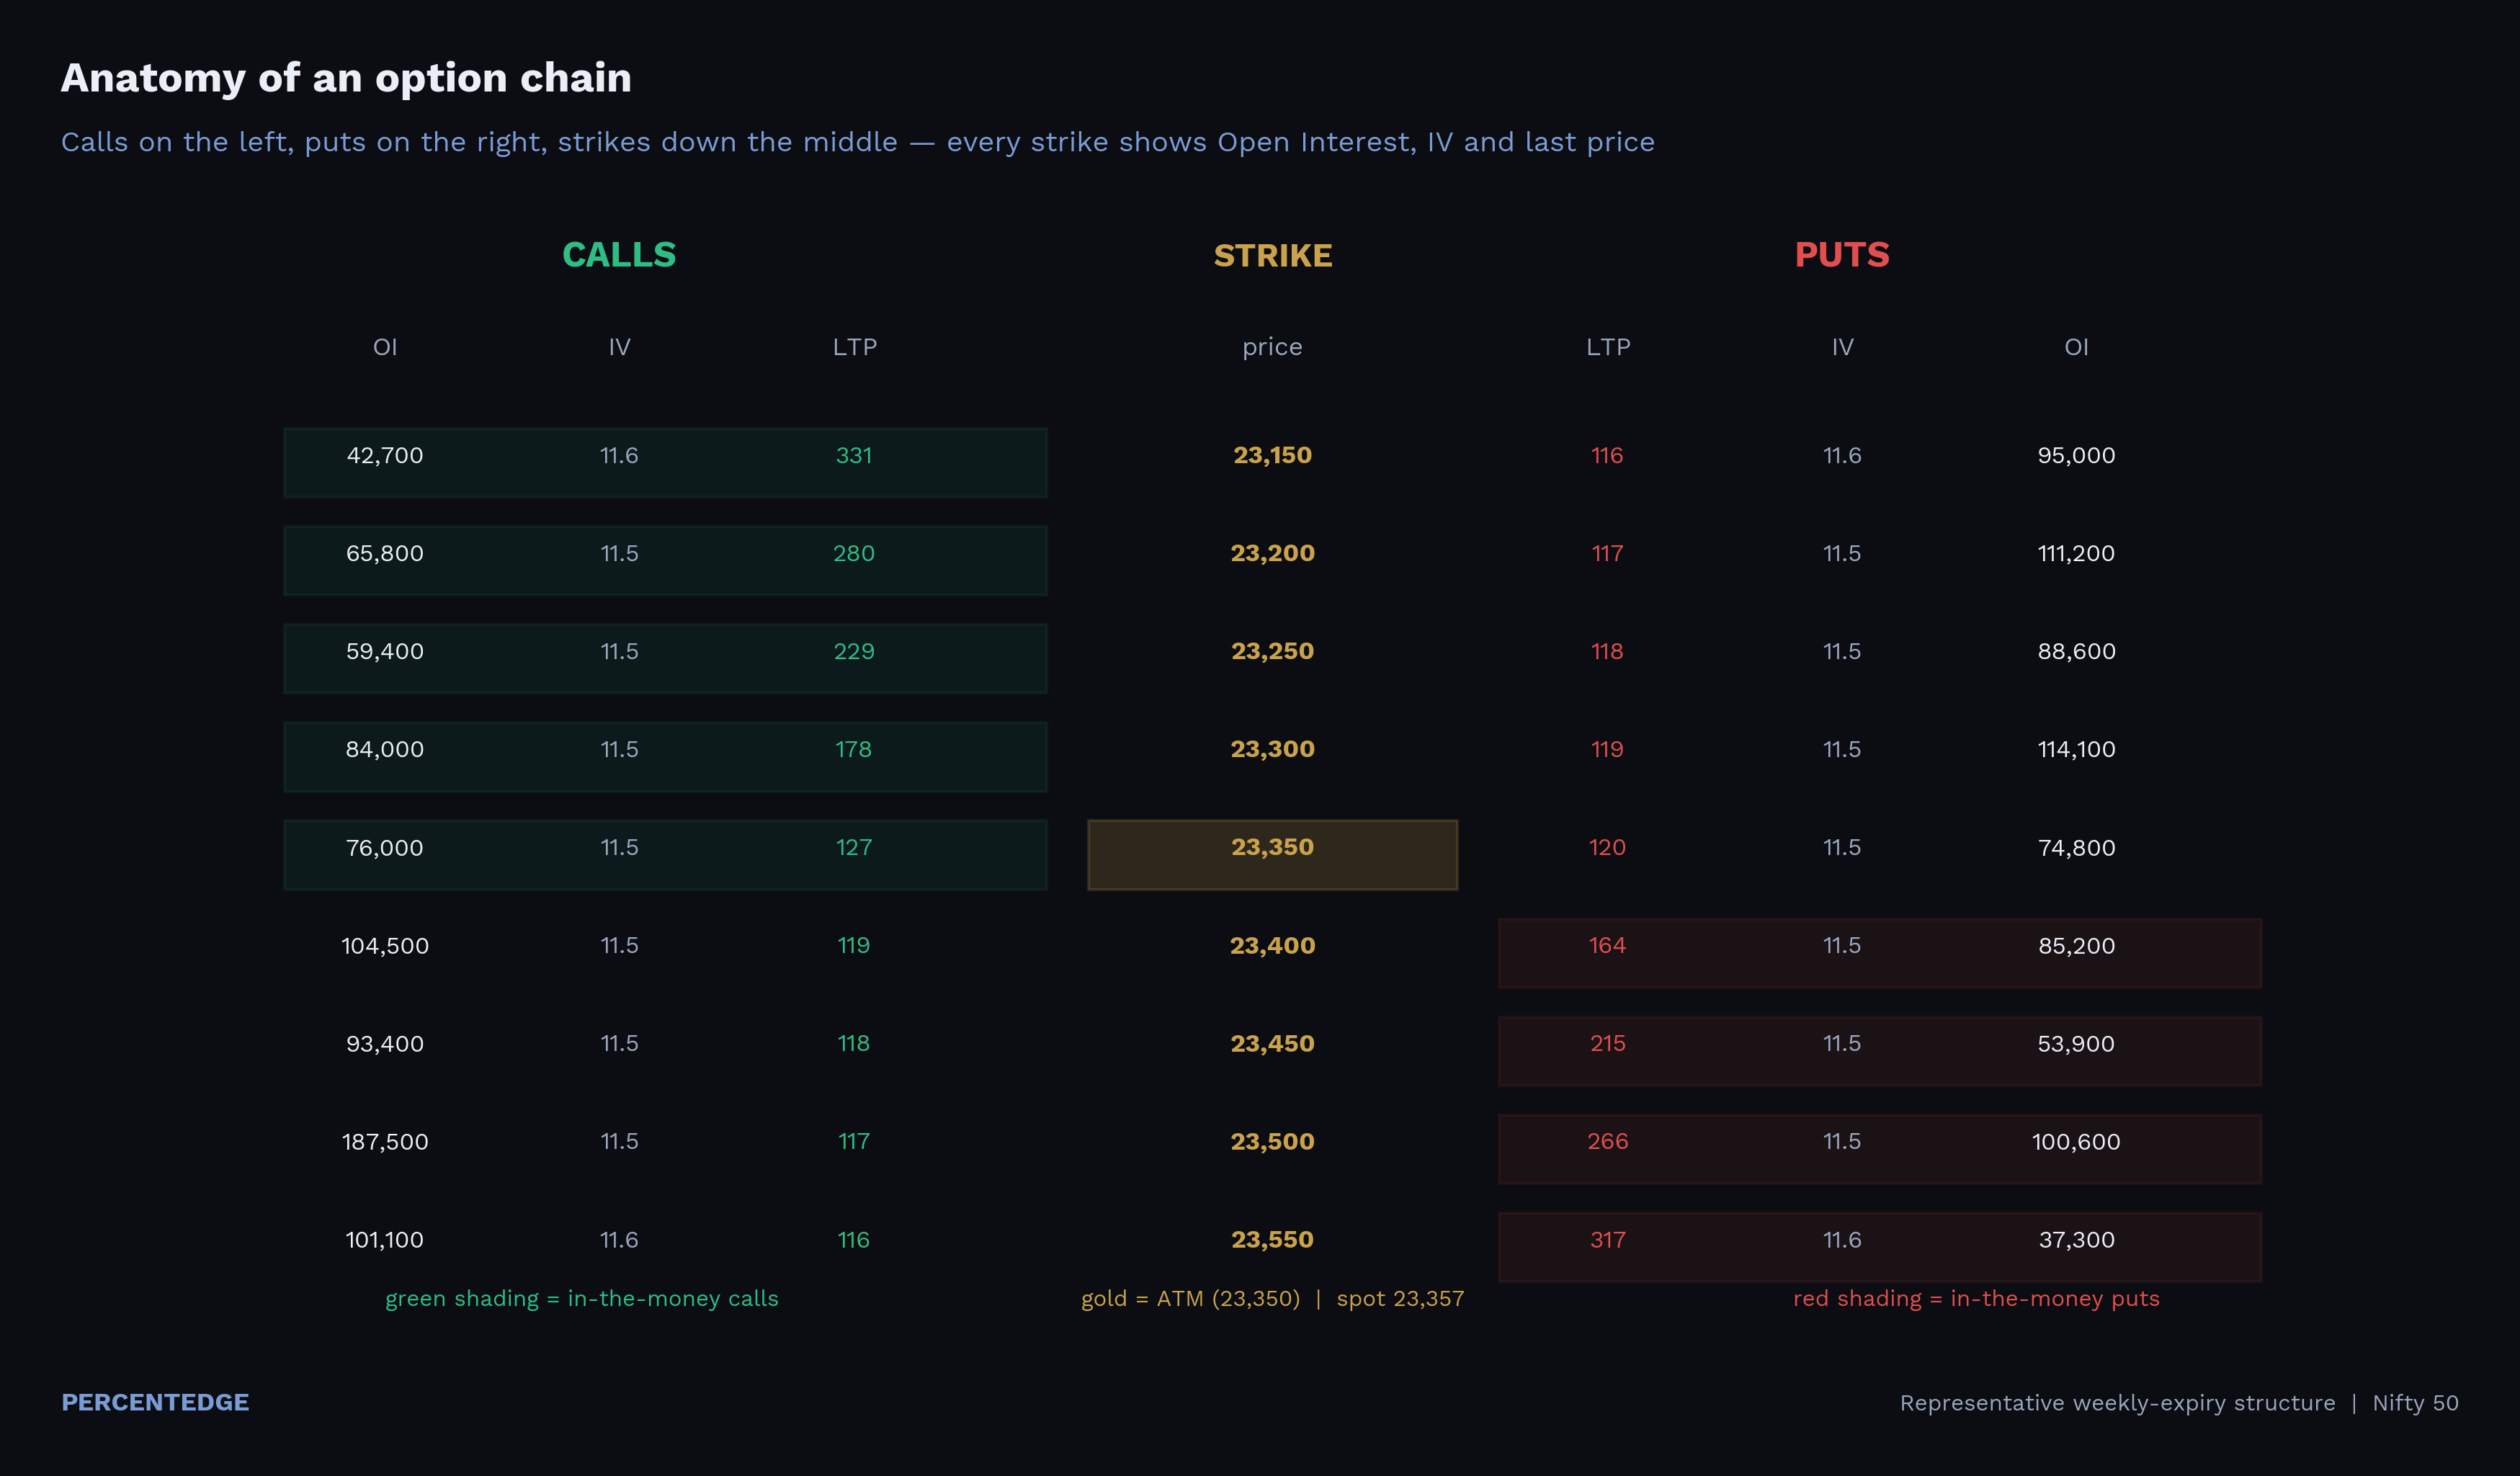
- A full section on the option chain, PCR, Max Pain & the Greeks
- Sophisticated indicators institutions actually use
- Instant PDF delivery, straight to your inbox
₹99₹99990% off
⏳ Limited-time launch offer
🔒 Secure payment via Razorpay · UPI, cards & netbanking
Instant delivery, emailed within 24 hours of payment.
What’s inside
Twelve chapters, one complete system
01Foundations: The Market as a Living Auction
02Timeframes: From the Monthly Down to the 3-Minute
03The Candlestick Vocabulary
04Market Structure: Trends, Swings, Support & Resistance
05Chart Patterns: Continuation & Reversal
06Fibonacci & Measured Moves
07Volume: The Market’s Conviction
08Sophisticated Toolkit I: Volume Profile, VWAP, CPR, CVD
09Sophisticated Toolkit II: Ichimoku, Supertrend, ADX, RRG
10Derivatives and the Option Chain: OI, PCR, Max Pain
11The Greeks & Implied Volatility
12Putting It All Together: From Signals to a System
A look inside
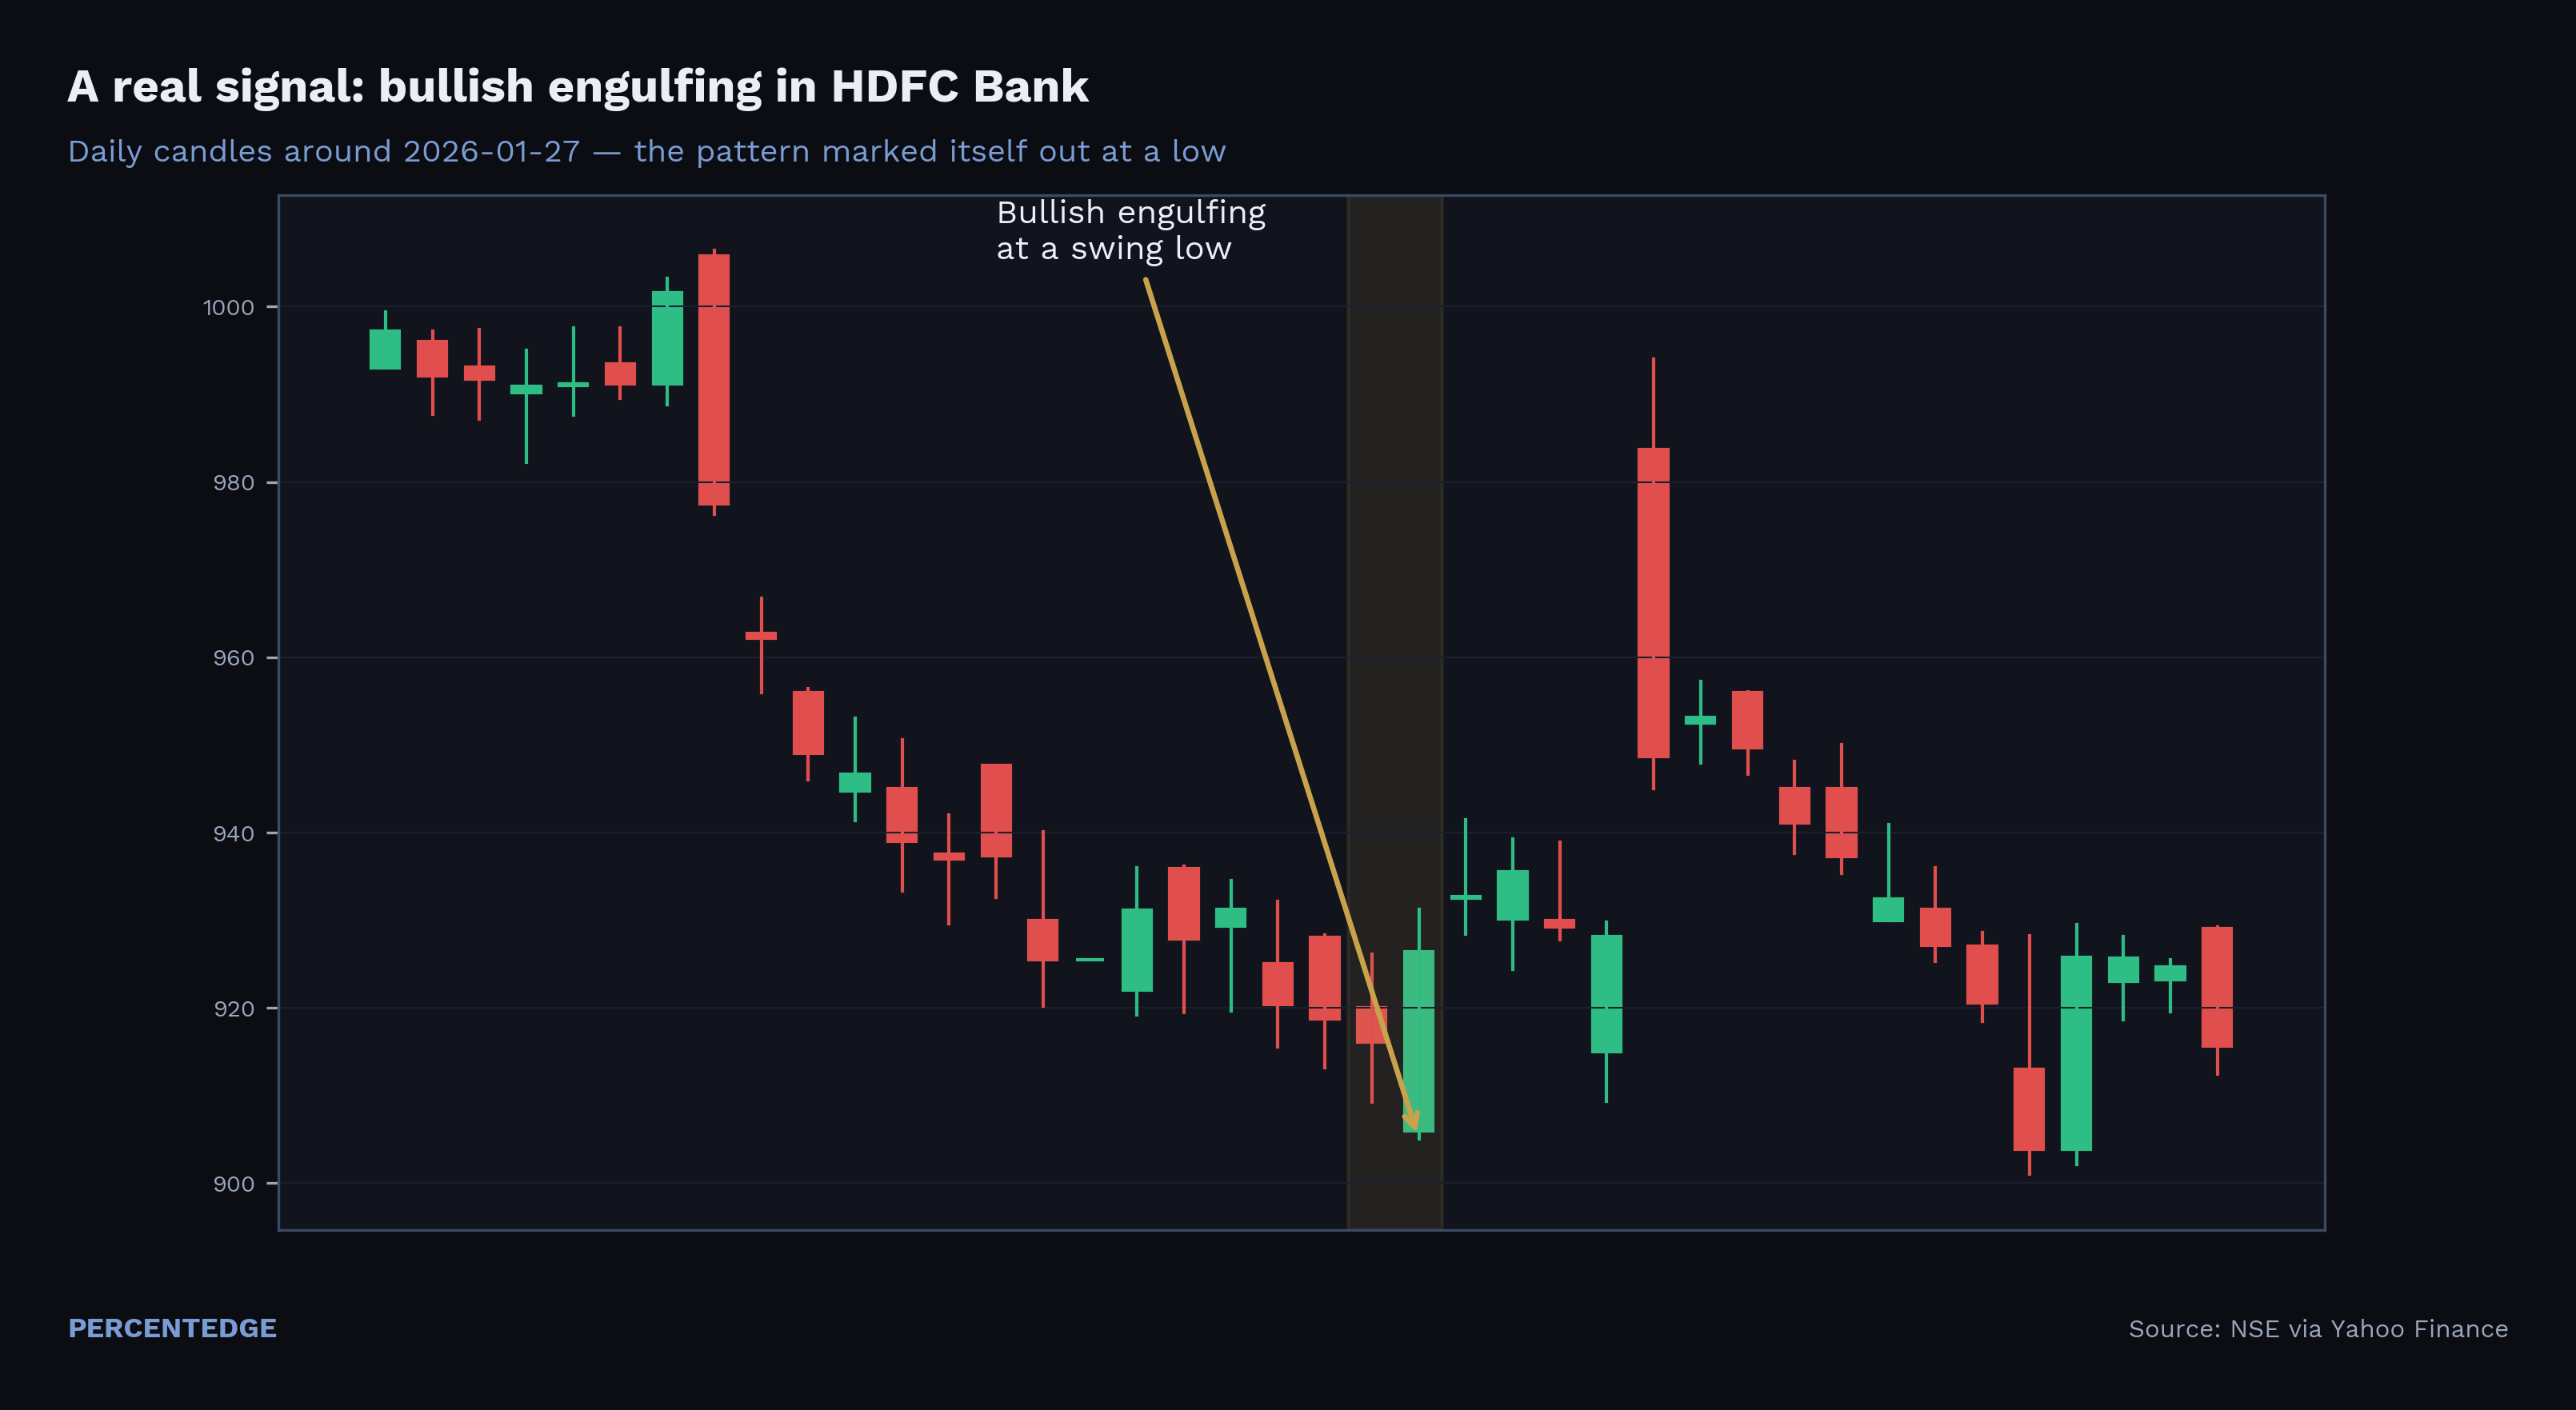
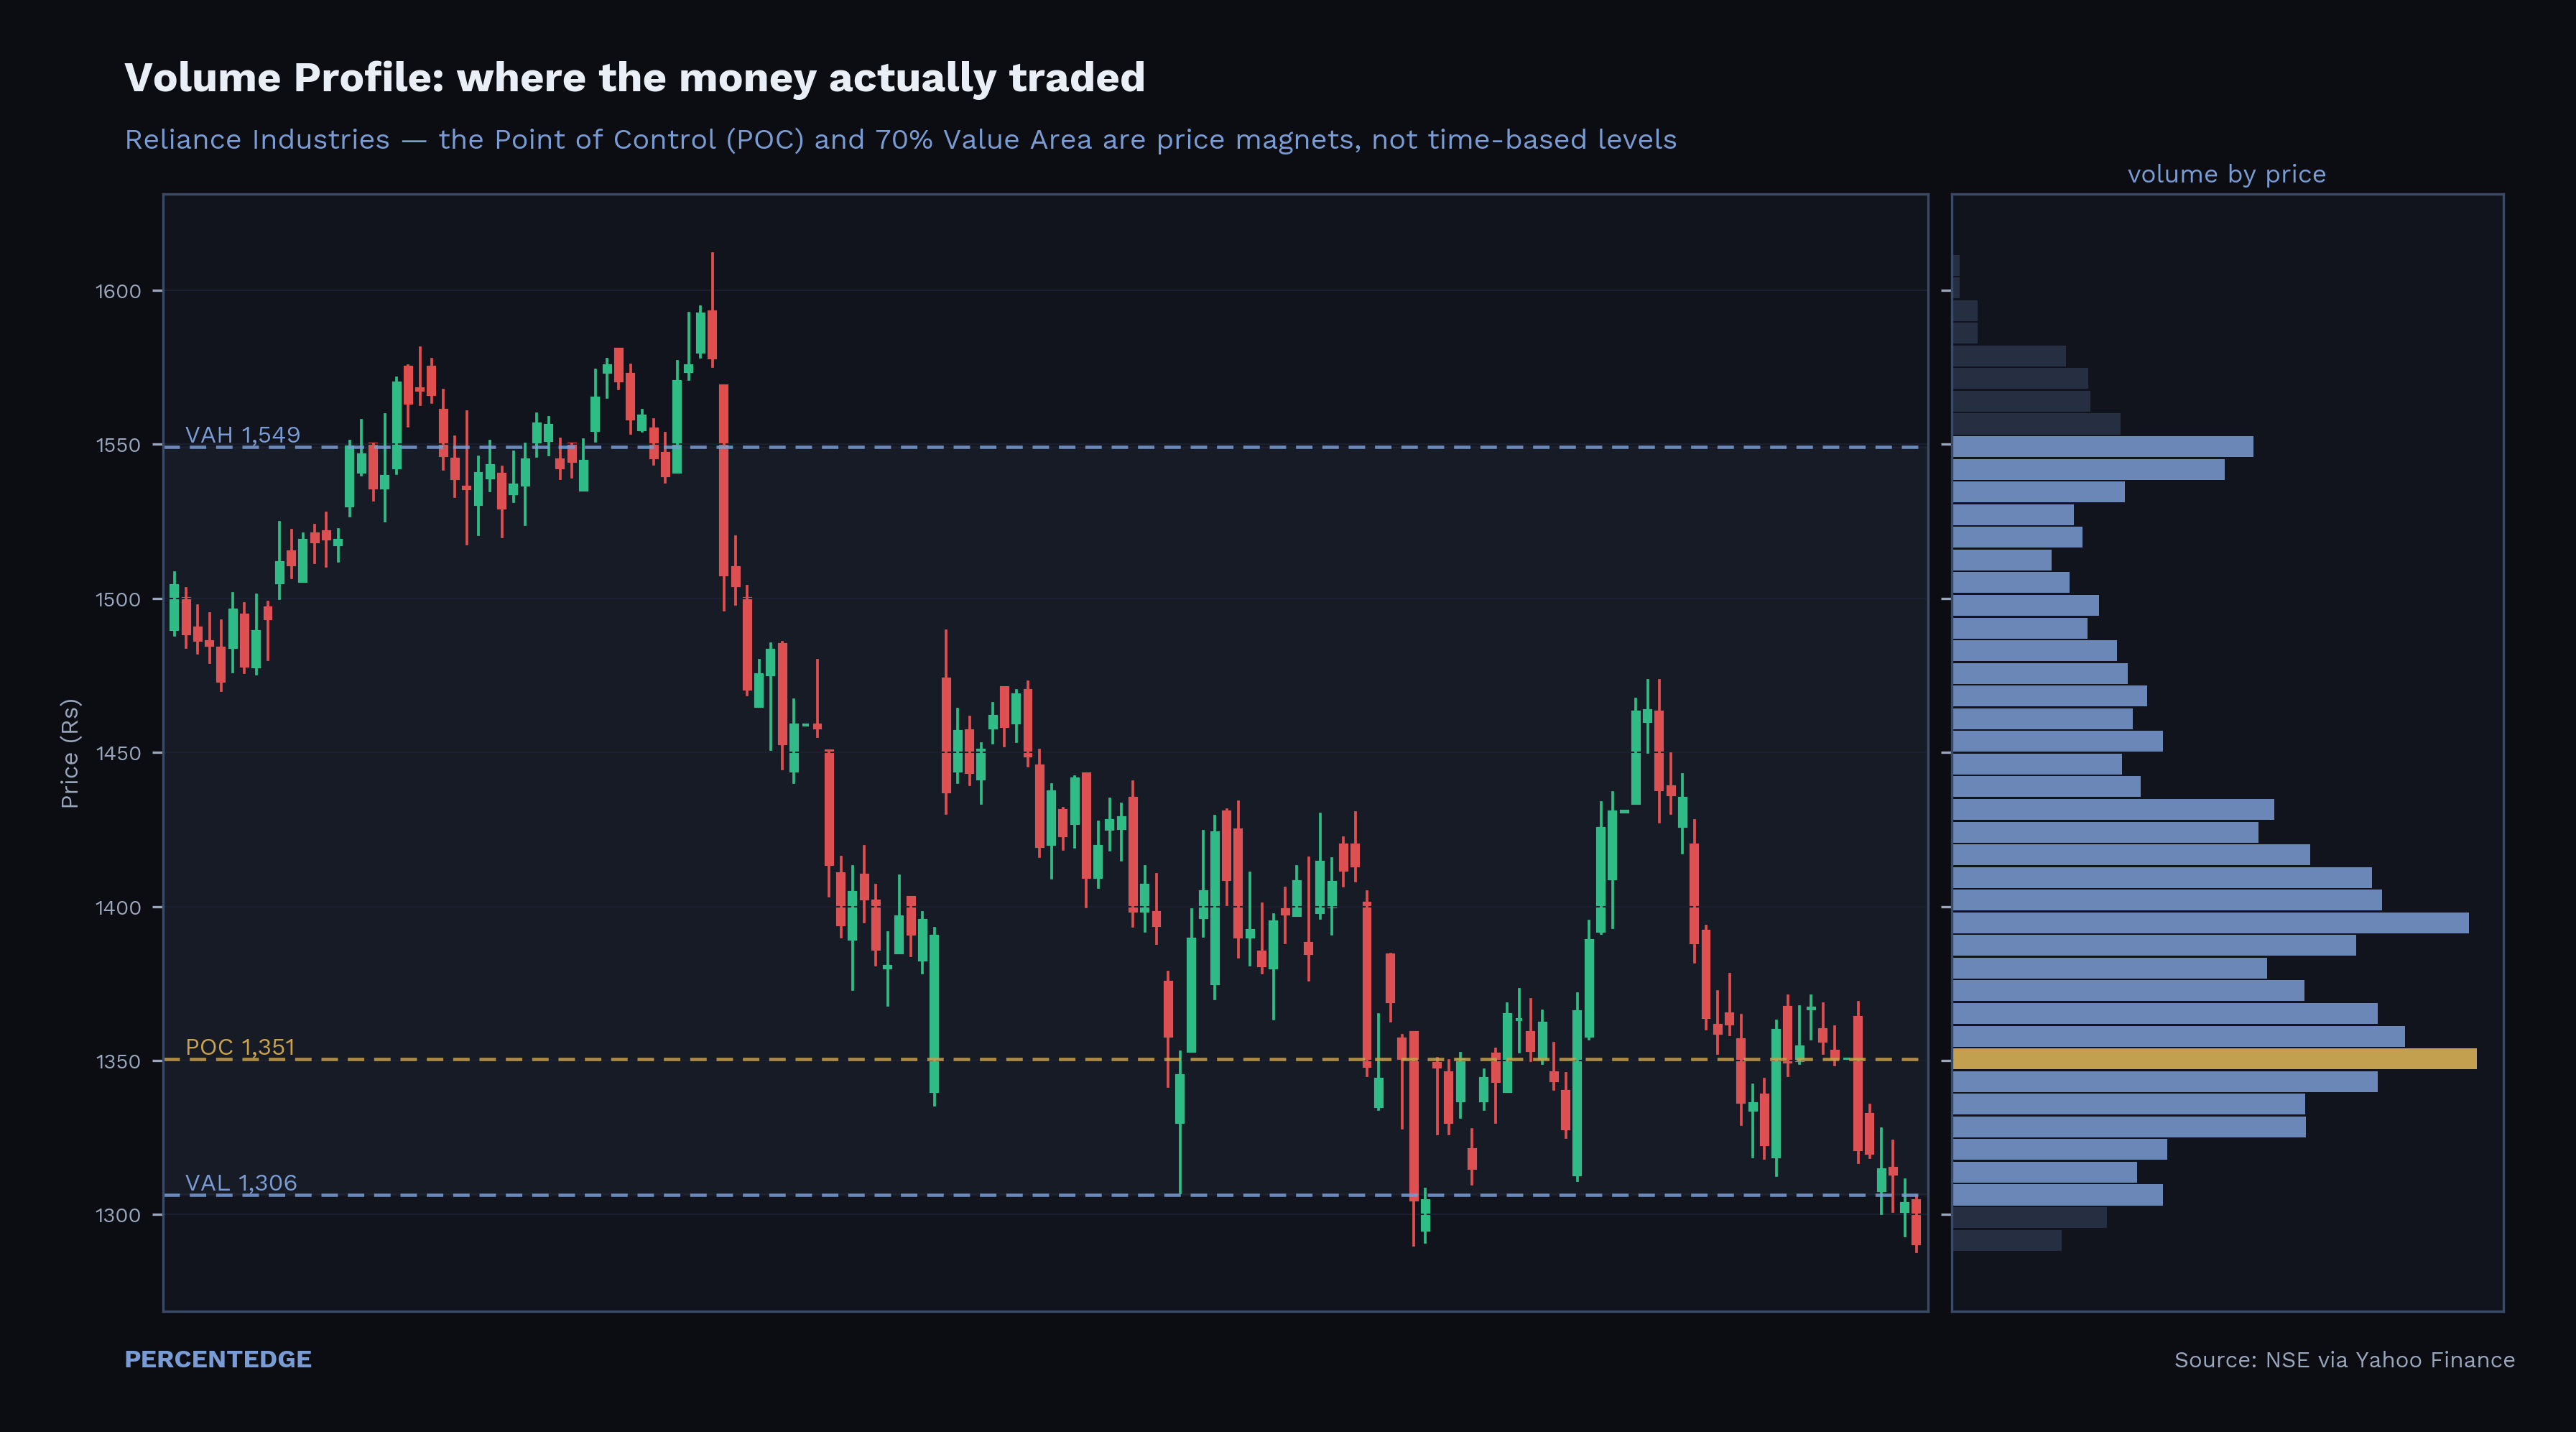
Real charts. Real signals.
FAQ